Power Generation

The Power Generation category contains case studies and blogs related to ITM’s power generation machinery engineering and testing services.

Machine Failures Caused by Intermittent Damaging Events

Over the years we have been tasked with identifying the root cause of machine structural failures. In many cases, we can determine the failure mode through strain and vibration testing, order analysis, modal analysis, and operating deflection shape analysis.  What tests can you run when the damaging conditions are intermittent and not easily identified?

In these cases, we like to install a cellular networked temporary data acquisition (DAQ) system that can autonomously log vibration and strain data along with machine status data. We have deployed two types of DAQ systems to collect data remotely.  An interactive system that includes an industrial PC running our iTestSystem software and National Instruments (NI) Compact DAQ hardware and a headless system that utilizes NI Compact RIO hardware.  Our test engineers prefer using the interactive solution for troubleshooting because they can view real-time signal waveforms and collected data files, and then adjust the test parameters accordingly without having to reprogram the hardware.

Rugged Measurement System

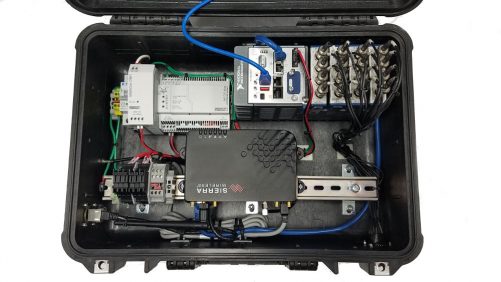
Figure 1: Headless networked data acquisition system

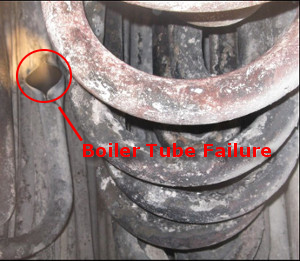
When potentially damaging events are identified in the vibration and strain data collected by these systems, it is important to know the machine’s operating status. Collecting the machine status information is just as important as collecting the structural data.  Many machines transmit these operating variables and operating stages over their network/bus.  Recently we have recorded process data from Allen Bradley Control Logix PLCs via Ethernet/IP, mining machine data from a Siemens controller via proprietary TCP/IP protocol, boiler condition data from a DCS via Modbus TCP,  machine pressures from PI historian via the UFL connector (TCP), and vehicle speeds and pressure via CAN.  Fortunately, we were able to use and adapt LabVIEW communication protocol tools to build applications and addons that allow this network tag data to be collected along with structural data.

LabVIEW Modbus to Shared Variable Code

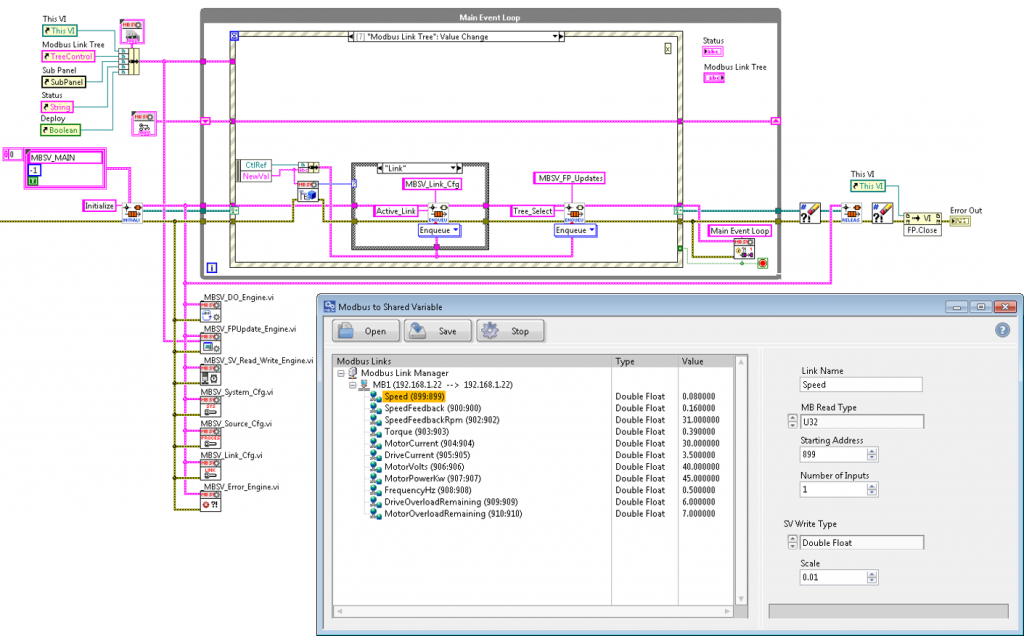
Figure 2: Modbus to Shared Variable Tool

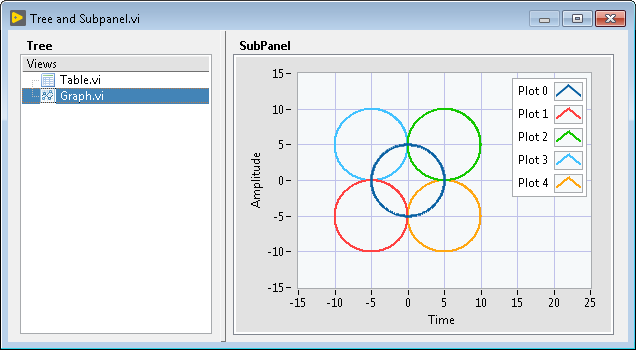
After the data collection phase, our engineers perform statistical analysis on the sensor and status channels in all data files and aggregate the results into a database for searchability. To identify the root cause probabilities, you can process the channel statistics data using your favorite correlation algorithm or application.  The image below shows an example data set containing related sensor data that was processed using a LabVIEW correlation test tool.

LabVIEW Correlation VI

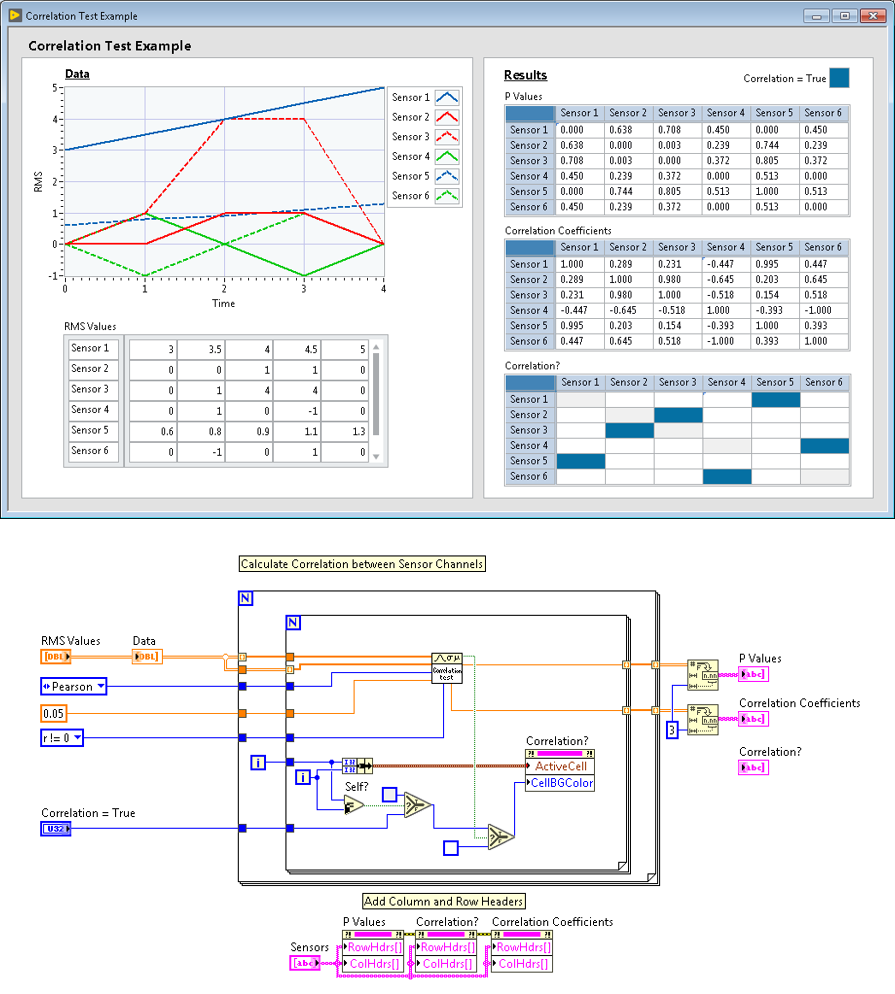
Figure 3: Correlation Test Example vi

Contact Information: For more information about our remote data acquisition service, our LabVIEW development service, or iTestSystem contact:

Mark Yeager – Integrated Test & Measurement (ITM), LLC.  Email: mark.yeager@itestsystem.com or Phone: 1.844.TestSys

Recent News:  Ohio University Asphalt Cracking Prediction System Project

Strain Gauge Installations for Field Testing

shaft torque sensor

Image1: Shaft torque strain gauge installation example for field testing

Our engineers and technicians have epoxied, soldered and spot welded strain gauges for applications ranging from high temperature exhaust systems to miniature load cell measurements. Every application requires a unique understanding of the strain measurement requirements including installation environment.

If the strain gauge installation is to survive in the field you must plan for the conditions it will undergo. Three important variables that you should account for are temperature range, liquid exposure, and potential impact forces. These variables determine the type of strain gauge, epoxy, solder, wiring, coating, and impact/wear protection to use in the application. The table below shows which variables affect your installation choices.

  Gauge Epoxy Solder Wiring Coating Covering
Temperature  
Liquid Exposure      
Impact Forces      

Table1: Strain gauge installation variables

For more information about ITM’s strain gauging services contact Ryan Welker at email: ryan.welker@itestsystem.com or phone: 1.844.837.8797 x702

Roving Accelerometer Impact Tests with iTestSystem

3D Animator: Bike Frame Twist Vibration Mode at 26.2 Hz

In order to prevent or troubleshoot structural vibration problems, it is important to characterize a structure’s dynamic behavior using both experimental and Finite Element Analysis (FEA) technologies.  One method used to identify a structure’s vibration modes is to perform a roving accelerometer or roving hammer impact test.  In an impact test, engineers measure the response of a structure from an impulse delivered by a calibrated hammer using tri-axial accelerometers.

FRF View: Bike Frame Point 9 Coherence & Magnitude

Managing impact tests on large structures can be tedious and cost prohibitive, since they require collecting accelerometer responses at hundreds of locations to resolve the vibration motion.  Not only do test engineers need to keep track of the locations, they also need to keep track of the orientation that an accelerometer is positioned.

Our test engineers have found that the most efficient and cost effective solution for collecting impact data is to use a National Instruments (NI) cDAQ chassis with either NI-9234, NI-9232, NI-9231 or NI-9230 IEPE modules along with a calibrated impulse hammer and between 3 – 9 tri-axial accelerometers. To collect, manage, and visualize the modal data, our LabVIEW software engineers developed the Impact Test DAQ, FRF Viewer, and 3D Animator applications for our iTestSystem software platform. These applications incorporate tools that our test engineers need to manage and validate the quality of their modal data while in the field.

For more information about impact tests, modal analysis, our iTestSystem Impact Test applications, or to schedule a modal test contact Mark Yeager or Ryan Welker.

iTestSystem Download

Sootblower Fouling Detection (SFD) presented at BLRBAC Spring 2019


We would like to thank the Black Liquor Recovery Boiler Advisory Committee (BLRBAC) for allowing us to present our patented Sootblower Fouling Detection (SFD) technology at the Spring 2019 meeting in Atlanta, GA.  SFD is ITM’s patented technology for measuring fouling/slagging along the path of an active sootblower in recovery and utility boilers.

During this presentation, Tim Carlier described the original SFD concept, the system’s Key Performance Indicator (KPI) outputs for closed or open loop control, and the system’s potential sootblower steam savings of 1-4% MCR.  He also highlighted the safety and maintenance benefits that the system provides.

For more information about the SFD technology or to schedule an online presentation or site visit to audit your specific application, contact Tim Carlier or Ryan Welker.

Contact Info:

Tim Carlier, President, tim.carlier@itestsystem.com, 513.608.4811

Ryan Welker, Business Development Manager, ryan.welker@itestsystem.com,  513.405.0181

Building a Modern User Interface in LabVIEW

When we develop LabVIEW™ applications for our customers, a common request is for a simple, resizable and intuitive user interface (UI) for data visualization.  In these cases, we use a tree control and a subpanel.  This type of UI functions like a tab control that automatically resizes.  The main benefit of using a subpanel is to make your code more modular.

Figure 1: Modern User Interface with a Tree and Sub Panel.

To illustrate the modularity that this type of UI creates, I made an example LabVIEW™ project.  The main VI shown above uses a tree control to switch between a VI containing a graph and a VI containing a table.  I used our multi-queue event architecture for VI information communication messaging.  The image below shows the main VI’s significant functions.

Figure 2: Main VI’s Block Diagram – Significant Functions

The main VI’s functions are listed below.

Functions

  1. Initialize queues and events and then generate initialize event.
  2. Initialize tree and add tree items.
  3. When a user selects an item in the tree, generate data and then send it to the subpanel VI.
  4. Receive SubPanel Ready event from a subpanel VI and then insert the VI into the subpanel.
  5. Destroy queues and unregister for events.

In this example the subpanel VIs are very simple.  They populate an indicator (table or graph) and then generate a SubPanel Ready Event.  The two (2) subpanel VIs and block diagrams are shown below.

Figure 3: SubPanel VIs: Graph.vi and Table.vi

Contact Information: For more information on this example or our LabVIEW development service contact:

Mark Yeager – Integrated Test & Measurement (ITM), LLC.  Email: mark.yeager@itestsystem.com or Phone: 1.844.TestSys

Boiler Monitoring Technologies at BLRBAC Spring 2019 Meeting


Integrated Test & Measurement (ITM) is presenting its patented Sootblower Fouling Detection (SFD) technology at the Spring 2019 Black Liquor Recovery Boiler Advisory Committee (BLRBAC) meeting in Atlanta, GA on Wednesday, April 10, 2019.

ITM’s SFD system effectively offers the following benefits to boiler operations:

  • Optimizes sootblowing to reduce boiler fouling
  • Reduces sootblower steam consumption
  • Detects sootblower mechanical faults
  • Identifies dangerous conditions around packing leaks

Find out more about ITM’s Sootblower Fouling Detection (SFD) system and other Boiler Monitoring Solutions at https://itestsystem.com/solutions/industrial-monitoring-systems/

Conference details can be found at http://blrbac.org/meeting-registration

Have questions? Contact Tim Carlier @ Tim.Carlier@iTestSystem.com

Archiving CompactRIO Process Data to PI

The tool we most commonly use for real-time embedded process monitoring and control applications is the NI CompactRIO.  These controllers allow us to embed algorithms that acquire and analyze high speed process sensor data and then output derived key performance indicators (KPIs) to other control systems.  Most of the time, our customers also require us  to send the KPIs to a real-time data infrastructure like OSIsoft’s PI System so plant managers and engineers can use the data to find energy savings, monitor asset health, or optimize processes.

For our latest CompactRIO systems we have developed APIs that allow us to send or receive data directly to/from PI.  We utilize the PI Asset Framework and the UFL Connector to automatically generate PI tags from the device and update the process tag values either on value change or on a time basis.

These tools greatly simplify our CompactRIO to PI System communication process by eliminating intermediary data servers and automatically generating PI tags based on a CompactRIO system’s configuration.  If you are interested in using these APIs for PI or developing a CompactRIO system contact Mark Yeager or Chase Petzinger.

ITM’s Patented Technologies Prevent Boiler Tube Leaks

The US patent office has recently awarded patents to ITM for (2) two of the underlying boiler safety and process optimization technologies embedded within our CDS and SHOP systems.  These systems monitor boiler conditions and alert operators when boiler tube damaging events/conditions occur.

Clinker Detection System (CDS)US Patent 10060688B2

The Clinker Detection System (CDS) measures the relative weight, location, and frequency of clinkers that impact a boiler floor. This technology enables operators to shorten boiler outages, identify fouling problems, optimize soot blower operations and identify damaging impact events.

Superheater OverHeat Protection (SHOP)US Patent 9541282B2

The Superheater OverHeat Protection (SHOP) system helps mitigate the risk of superheater tube failure due to short-term overheat during boiler start-ups.    Catastrophic thin-lipped bursts  can occur in superheater steam generation tubes when steam flow is insufficient, when deposits restrict flow, or when tubes are blocked by water due to a rapid firing rate during boiler start-up.  SHOP assists operators in the management of boiler start-ups by enabling the detection of superheater tube clear events (TCE’s).

If you’re interested in learning more about these systems and other boiler/process monitoring solutions, feel free to contact Ryan Welker by e-mail at ryan.welker@itestsystem.com or phone at (844) 837-8797.

Putting a HALT to Hazardous Hopper Maintenance – Power Magazine


Check out my article “Putting a HALT to Hazardous Hopper Maintenance” in the May 2018 edition of Power Magazine.  This article describes a system for detecting dangerous plugging conditions inside ash hoppers.  Ash hoppers are used in the power industry to collect hot ash from utility boilers. – Mark Yeager

Follow the link below for the on-line version.

https://www.powermag.com/putting-a-halt-to-hazardous-hopper-maintenance

For more information about a Halt System or our other Boiler Monitoring Systems contact Ryan Welker @ (844) 837-8797 x702


Increase the IQ of Your Intelligent Sootblowing in Power Magazine

Check out the article “Increase the IQ of Your Intelligent Sootblowing” by my colleague Mark Yeager in the December edition of Power Magazine.  In this article, Mark describes ITM’s Sootblower Fouling Detection (SFD) technology which allows for targeted sootblowing, by pinpointing exactly when and where sootblowing is required in chemical recovery and coal-fired power boilers.

https://www.powermag.com/increase-the-iq-of-your-intelligent-sootblowing