Tag Archive for: cRIO

Industrial Monitoring Tools: cRIO-9046 Embedded Controller

CompactRIO cRIO-9046

One of the tools our embedded software engineers commonly use for industrial control and process monitoring applications is the NI CompactRIO (cRIO) controller. These controllers let our engineers deploy autonomous systems that use complex algorithms to generate process outputs or key performance indicators (KPIs) from structural, vibration, and process monitoring sensors.

For example, in one of the latest industrial boiler monitoring applications, we embedded a cRIO-9046 controller with our Sootblower Fouling Detection (SFD) algorithms which are used to compute and then output equipment health and process efficiency KPIs. Let’s take a look at the cRIO-9046 controller’s specifications, functionality and programming.

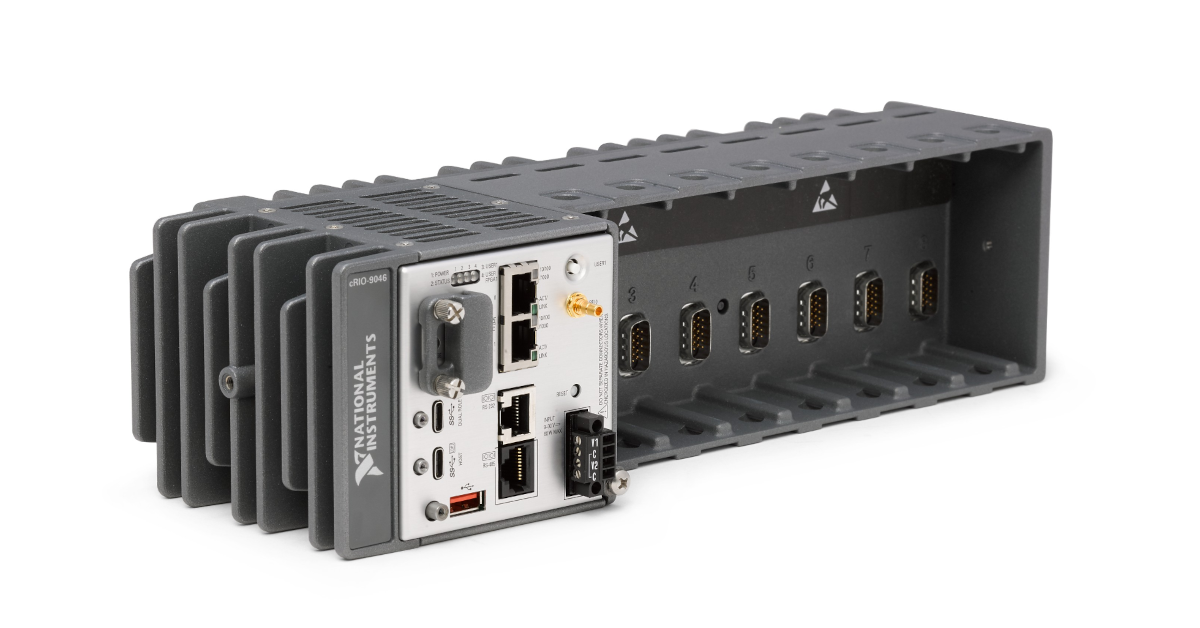
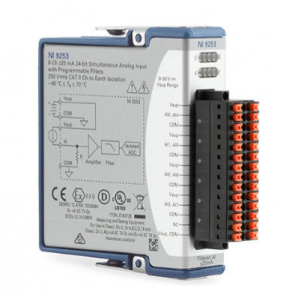
cRIO-9046 is an 8-Slot CompactRIO Controller that has an Intel Atom 1.30 GHz Dual-Core CPU, 2 GB DRAM, 4 GB Storage, a Kintex-7 70T FPGA that can operate from -40 °C to 70 °C. The eight slots are used for C-Series conditioned IO modules that connect sensor inputs and data/control outputs and buses.

Its operating system, NI Linux Real-Time (64-bit), allows real-time performance with the usability desktop operating systems. Our engineers use Xilinx Kintex-7 7K70T FPGA to implement high-speed, (MHz) low-latency hardware-level data processing and decision-making. The cRIO-9046 also has several connectivity ports, including 2x Gigabit Ethernet, USB 3.1, USB 2.0, RS232, and RS485 ports.

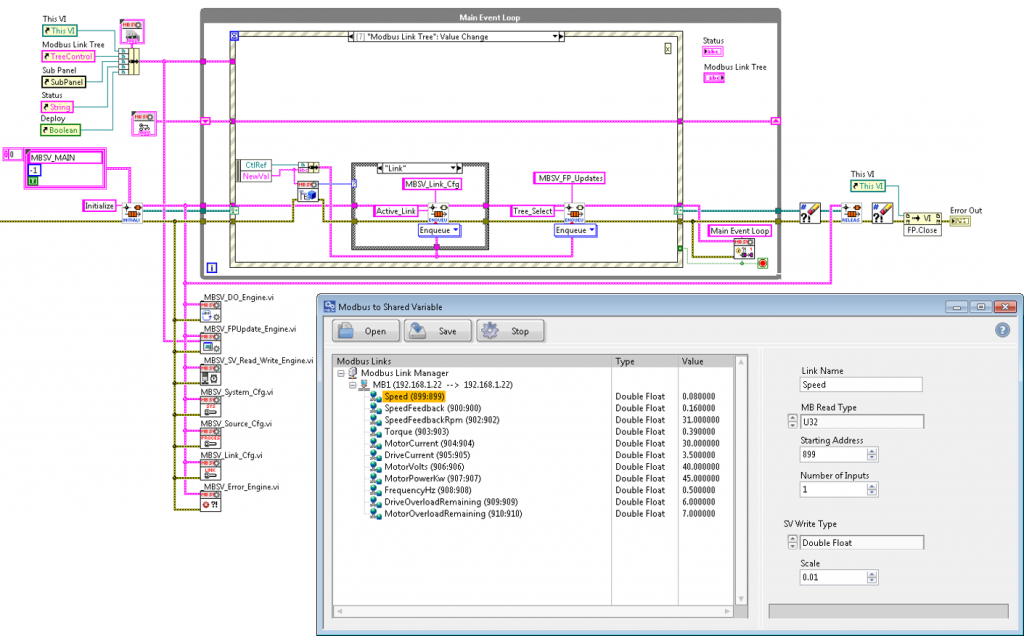
Embedded LabVIEW developers can use these ports and standard communication protocol toolkits to develop standard or custom machine/system interfaces.

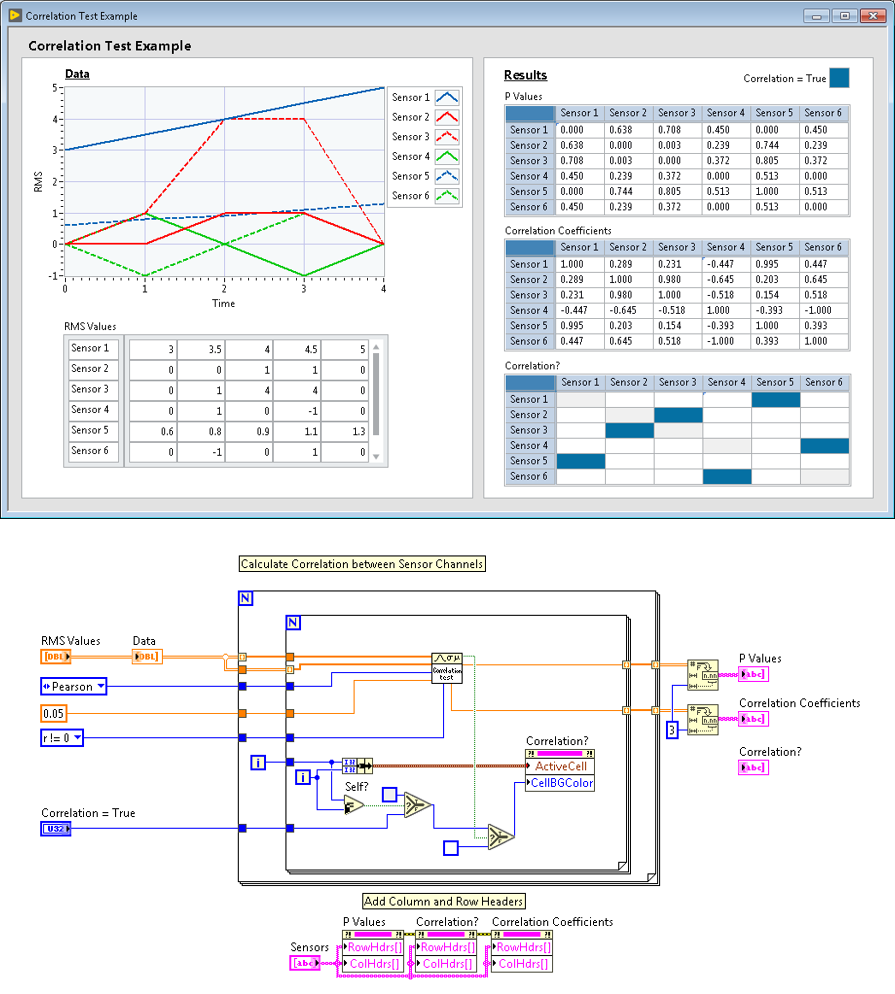
For a cRIO-9046 or other CompactRIOs to operate, custom LabVIEW RT applications must be developed and then deployed to each controller. Depending on the complexity of your application, you may also need to develop and deploy LabVIEW FPGA code to the cRIO’s FPGA. Over the years, our embedded software engineers have developed a standard architecture as well as software tools for communication and analysis routines to simplify the custom LabVIEW RT application development. They also have experience developing embedded LabVIEW FPGA code for advanced hardware-level signal processing.

For more information about the cRIO-9046 and our LabVIEW development capabilities, contact Mark Yeager via email at mark.yeager@itestsystem.com

Related Links

Video: Custom Rugged Data Acquisition Systems


Check out this video showing one of our custom rugged data acquisition systems! We provide custom systems like this for aerospace, vehicle, off-highway, and civil applications.  This system shown in this video was designed for collecting strain, vibration, and other sensors on a civil structure.

For more information about our testing services and custom test systems, contact Ryan Welker via email: ryan.welker@itestsystem.com or phone (844) 837-8797 x702

Silo Load Monitoring


Plant operators need to continuously measure bulk material levels/weight in their silos and hoppers to ensure their processes are running safely, efficiently, and without bottlenecks. Measuring these levels allows operators to automate vessel filling, verify material consumption, and prevent overfilling.

What we offer

ITM provides its customers with a variety of structural load monitoring systems. Using strain gauge based transducer technology, ITM can design and implement a real-time system to continually monitor load responses of the supporting members on an array of structures.

Strain gauge based measurements are more accurate and typically less expensive than load cell retrofitting. The addition of a monitoring system can also reduce the risks associated with manual measurements including contamination of product and, more importantly, injury to a worker.  

How do you measure bulk material levels/weights in silos and hoppers?

The two ways to measure bulk material quantity in silos/hoppers are level indicators (laser, ultrasonic, radar) and weight measurements (load cells, strain gauges).  Weight measurements are more accurate, safer to install, and can be installed during operation.  Of the types of weight measurements, ITM prefers to implement strain gauge-based solutions since they do not require structural modification of the vessel.

An ITM silo monitoring system typically consists of weatherproofed strain gauges for each silo leg and a NI CompactRIO embedded controller to acquire data, process signals, and output results. Systems are scalable to accommodate all the silos at the plant.

The graph above shows a typical trend of real silo data during unloading.  Weight levels are sent directly to factory DCS systems and historians via common communication protocols like Ethernet/ip and Modbus, or they can be viewed on the system’s webpage or a local/remote workstations and panels.

What are the challenges when measuring bulk material levels/weights?

Most bulk material storage is outside, so temperature and other environmental factors must be accounted for not only in the durability of the equipment, but in the sensor design and data processing. Changes in temperature, wind, and humidity can result in changes to the load path in silo legs. Load changes are account for by instrumenting all or most of the silo legs and selecting the appropriate strain gauge bridge design which results in continuously accurate weight measurements.

While other systems require calibrating the system with known loads (point calibration), ITM calibrates the system using a shunt voltage across the strain gauge bridge. This process automatically calibrates the system and eliminates the requirement of having pre-known material weight added to the vessel.

For more information about silo monitoring, contact Ryan Matthews @ 1.844.837.8797 x706.  To see how ITM’s structural load monitoring systems work watch this video below.

Another Successful Condition Monitoring System Installation


Last week our team successfully and safely installed another Boiler Monitoring System (BMS).  This system, a Sootblower Fouling Detection (SFD) system, monitors structural and vibration sensors that quantify the boiler’s response to sootblower operations. The SFD system analyzes the boiler response data and outputs Key Performance Indicators (KPIs) such as fouling level, sootblower efficiency, and sootblower health to automated boiler cleaning systems.

This boiler uses over 50 sootblowers located at different elevations to clean soot build-up from boiler steam tubes.  Since the vibration measurement locations are relatively far apart, the SFD system requires a distributed monitoring system consisting of several junction  boxes that monitor and process data for groups of sensors.  One team of engineers mounted the vibration sensors to the sootblowers and confirmed communication back to a local junction box containing the National Instruments condition monitoring hardware.  The other team installed the junction box panels and terminated the sensor cables.

After all the sensor installations and terminations were completed, each sensor’s location and calibration were verified.  While the sensor verification was being completed, one engineer worked with the mill IT department and the controls engineer to establish remote connection to the system and confirm communication with the mill’s automated cleaning system.

After commissioning the system and returning to our home base, our engineers are now monitoring the system through a VPN connection and assisting boiler operators with optimizing their cleaning process.

For more information about our ryan.welker@iTestSystem.com or phone @ 1.844.837.8797 x702

Machine Failures Caused by Intermittent Damaging Events

Over the years we have been tasked with identifying the root cause of machine structural failures. In many cases, we can determine the failure mode through strain and vibration testing, order analysis, modal analysis, and operating deflection shape analysis.  What tests can you run when the damaging conditions are intermittent and not easily identified?

In these cases, we like to install a cellular networked temporary data acquisition (DAQ) system that can autonomously log vibration and strain data along with machine status data. We have deployed two types of DAQ systems to collect data remotely.  An interactive system that includes an industrial PC running our iTestSystem software and National Instruments (NI) Compact DAQ hardware and a headless system that utilizes NI Compact RIO hardware.  Our test engineers prefer using the interactive solution for troubleshooting because they can view real-time signal waveforms and collected data files, and then adjust the test parameters accordingly without having to reprogram the hardware.

Rugged Measurement System

Figure 1: Headless networked data acquisition system

When potentially damaging events are identified in the vibration and strain data collected by these systems, it is important to know the machine’s operating status. Collecting the machine status information is just as important as collecting the structural data.  Many machines transmit these operating variables and operating stages over their network/bus.  Recently we have recorded process data from Allen Bradley Control Logix PLCs via Ethernet/IP, mining machine data from a Siemens controller via proprietary TCP/IP protocol, boiler condition data from a DCS via Modbus TCP,  machine pressures from PI historian via the UFL connector (TCP), and vehicle speeds and pressure via CAN.  Fortunately, we were able to use and adapt LabVIEW communication protocol tools to build applications and addons that allow this network tag data to be collected along with structural data.

LabVIEW Modbus to Shared Variable Code

Figure 2: Modbus to Shared Variable Tool

After the data collection phase, our engineers perform statistical analysis on the sensor and status channels in all data files and aggregate the results into a database for searchability. To identify the root cause probabilities, you can process the channel statistics data using your favorite correlation algorithm or application.  The image below shows an example data set containing related sensor data that was processed using a LabVIEW correlation test tool.

LabVIEW Correlation VI

Figure 3: Correlation Test Example vi

Contact Information: For more information about our remote data acquisition service, our LabVIEW development service, or iTestSystem contact:

Mark Yeager – Integrated Test & Measurement (ITM), LLC.  Email: mark.yeager@itestsystem.com or Phone: 1.844.TestSys

Recent News:  Ohio University Asphalt Cracking Prediction System Project

ITM adds NI-9253 Compatibility to iTestSystem

This week we added another module to the iTestSystem compatibility list.  One of our iTestSystem users recently needed to collect data from thirty-two (32), 4 to 20 mA current sensors along with their vibration measurements.  National Instruments (NI) recently introduced a new C-Series current module, the NI-9253, that was a perfect fit for this application.

The NI-9253 module has eight (8) simultaneous sampled (50kHz max), +-20 mA, 24-bit input channels.  It has several diagnostic features to ensure your system is operating nominally at all times with open channel detection, power supply detection, and configurable thresholds. The NI-9253 has eight LEDs that indicate the status of each channel and the power supply so a user can easily determine the system’s status in the field.  The NI-9253 also features a number of programmable hardware filters (Butterworth and comb) to reduce signal noise.

in iTestSystem monitoring applications or with custom cRIO RT and FPGA control applications contact Mark Yeager or Chase Petzinger.

Archiving CompactRIO Process Data to PI

The tool we most commonly use for real-time embedded process monitoring and control applications is the NI CompactRIO.  These controllers allow us to embed algorithms that acquire and analyze high speed process sensor data and then output derived key performance indicators (KPIs) to other control systems.  Most of the time, our customers also require us  to send the KPIs to a real-time data infrastructure like OSIsoft’s PI System so plant managers and engineers can use the data to find energy savings, monitor asset health, or optimize processes.

For our latest CompactRIO systems we have developed APIs that allow us to send or receive data directly to/from PI.  We utilize the PI Asset Framework and the UFL Connector to automatically generate PI tags from the device and update the process tag values either on value change or on a time basis.

These tools greatly simplify our CompactRIO to PI System communication process by eliminating intermediary data servers and automatically generating PI tags based on a CompactRIO system’s configuration.  If you are interested in using these APIs for PI or developing a CompactRIO system contact Mark Yeager or Chase Petzinger.

ITM Installs Paper Mill Thermocouple Monitoring System

control panel

In search of a system that would send feedback to further optimize their production efficiencies and reduce energy costs, a paper mill company turned to ITM for help measuring the temperature of steam tubes inside its Recovery boiler.

The challenge our engineers faced was to not just log temperature measurements, but also to transfer this information to a remote computer, perform complex measurements and output results that would serve as a watchdog to ensure normal conditions.

Our solution was yet another example of finding a creative way to use existing National Instruments hardware and software to solve a complex problem.

See the complete Case Study.

— ITM President Tim Carlier