Tag Archive for: LabVIEW

Waveform Resampling in LabVIEW

When measuring vibration and strain levels in LabVIEW, you work with a lot of waveform data.  Usually this waveform data needs to be resampled or quickly analyzed so it can be stored in databases and displayed as meaningful trends.  I put together the snippet below, so I could have easy access to the resampling and moving average waveform algorithms we commonly use.

For more information about this resample snippet, or our LabVIEW programming services contact Chase Petzinger @ (844) 837-8797 x704.

LabVIEW Channel: Splitter Bars


Figure 1: Example LabVIEW Front panel with Splitter Bars


In some of my earlier LabVIEW channel blogs I showed how to use a subpanel to build scalable module user interfaces.  This blog describes another front panel layout tool for creating professional scalable user interfaces – the splitter bar.  Splitter bars allow the user to resize the adjacent panes while an application runs.  NI explains the functionality of configure of splitter bars here.

The labVIEW example described below shows how splitters can be moved programmatically to create clean professional user interfaces.  This VI contains five (5) controls/indicators and two (2) splitter bars on the front panel.  A listbox is used to select which channels are displayed in the graph, while a table displays each channel’s statistics.  Each splitter bar’s position is controlled by a radio button containing two buttons (left and right for the vertical splitter and up  and down for the horizontal splitter).  When a splitter control button is initially pressed, its respective splitter bar snaps to the edge of the window and hiding the listbox or table.  When pressed again, the respective splitter moves back to its original position revealing the listbox or table.

Figure 2: Programmatically move splitter bars.

Try the LabVIEW snippet above to see the splitter functionality.  When you drop this snippet into a new VI, you will have to add  vertical and horizontal splitters to the VI. See figure 1 for a reference for where to place the splitters. Right click on the splitter to get a reference to each splitter, left pane and bottom pane to run the VI.  Wire these references into the appropriate bundle function.  Set the graph to scale with panel.  Do not set the listbox and table to scale with pane.

For more information about this splitter example, or our LabVIEW programming services contact Mark Yeager @ (844) 837-8797 x7041.  You can also email me at mark.yeager@itestsystem.com if you would like me to send you the example vi or download it here.

LabVIEW Channel: Sorting Cluster Arrays


Figure 1: Table with Sortable Columns.


Our LabVIEW programmers are often asked to build user interfaces to interact with configuration settings, data sets, file metadata, and databases.  Some examples of these interactive interfaces include, sorting data by parameters, plotting the top ten vibration peaks from a data set, or searching through data files for strain channels that exceed standard limits.

In LabVIEW, these types of data sets can be represented on the block diagram as an arrays of clusters.  A cluster is a LabVIEW data type that groups data elements of mixed types. A cluster is similar to a record or a struct in text-based programming languages.  An array is a group data elements of the same type. An array consists of elements and dimensions.

The VI shown in Figures 1 & 2 contains a table that is sorted when you double click on a column header.  The VI snippet in Figure 2 contains the VI with subvis removed.

Sortable Table VI Snippet Updated

Figure 2: Sortable Table VI Snippet

The VI snippet in Figure 3 contains some example array cluster sorting examples.  By Default A cluster is sorted by the first element and if there is a match the second element is used and so on. To control the sort priority, unbundle the elements you want to sort by then bundle them back above the original cluster. This new cluster can then be sent to the Sort 1D array VI.

Figure 3: Sort Cluster Array Examples VI Snippet.

For more information about interacting with large data sets in LabVIEW, or our LabVIEW programming services contact Chase Petzinger @ (844) 837-8797 x704.

LabVIEW Subpanel


Figure 1 – Radio Button control of VI insertion into subpanel.


One control combination that our LabVIEW development team uses to build modular adaptive user interfaces is the radio button, subpanel pairing.  Using the radio button to switch between vis displayed in a subpanel essentially allows you to  make a tab control that scales with the front panel during resizing events.

I built the vi shown in Figures 1 & 2 (linked here) to demonstrate how to insert dynamically called vi’s front panels into a subpanel.  In this example each radio button inserts a different 3D graph example vi into the subpanel by its reference.

Since the vis used in the subpanel are called dynamically, some extra steps may be required to build the exe.  The link below shows how to build an exe that uses dynamically called vis using the application builder.  I have also included some path tips that are useful when building LabVIEW executables (exe).

Related Link: Integration of Sub-Panel in the Front Panel of LabVIEW Executable – National Instruments (ni.com)

Figure 2 – Inserting a VI into a subpanel block diagram.Steps for Inserting a VI into a Subpanel

  1. Assign VI Name to a Button or Tree Item.
  2. Insert File Name into the Relative Path containing VIs to show in the Sub Panel.  See Notes
  3. Open a reference to the VI.
  4. If the VI is in the Idle state then run the VI.
  5. Insert VI into the Subpanel via a reference.

Notes

  • “..” will cause the Build Path VI to strip path once.
  • \ One extra \ is required per folder because the format into string function interprets backslashes as escape characters.

You can also use a tree control instead of a radio button to control which vi is inserted into the control panel.  An example of this method is illustrated in a previous blog titled “Building a Modern User Interface in LabVIEW“.   The vi shown in that blog uses a similar technique for building and selecting the which vi will be inserted into the subpanel.

Figure 3 – Insert VI into subpanel snippet.

Figure 3 above is a vi snippet of the Insert VI invoke node for a Subpanel. If you already have a subpanel, right click on the subpanel, create a reference and wire it to the subpanel invoke node.

To learn more about subpanels, other LabVIEW programming techniques, iTestSystem or our LabVIEW programming services contact Mark Yeager  @(844) 837-8797.

LabVIEW Dialog Snippet

Figure 1 – Framework for Simple Dialog VI Snippet

Here is a trick for creating a simple dialog in LabVIEW. Follow these simple steps to quickly create your next dialog in less than a minute. 

  1. Create a New VI .
  2. Drop the VI Snippet (Figure 1) above on the block diagram.
  3. Update the Window Appearance setting in VI properties to dialog (see Figure 2 below).
  4. Optional: Update with a Custom Window title.
  5. Save and run the VI.

Figure 2 – VI Properties/Windows Appearance

In the dialog template snippet I also used another useful snippet – the error case structure.  This simple VI snippet will help you save time with your next project.

What’s next? 

Common snippets for folder creation and cluster sorting.

LabVIEW VI Snippets


If you’ve ever managed or work with a team of programmers, you realize that each person has their own programming style.  If programming team members always use their own code and style, they cannot develop code effectively.

A critical practice for getting programming teams to work efficiently is code re-use.  In LabVIEW there are many ways to implement code re-use.  In this blog I decided to revisit one of these code re-use strategies, the VI Snippet.  

What is a VI Snippet? 

“VI Snippets are a way to store, share and reuse small portions of LabVIEW code. VI Snippets combine the portability of a screenshot with the functionality of a VI file by embedding LabVIEW code in a standard PNG image. When you drag a VI Snippet PNG image onto the block diagram it will drop the snippet as graphical code that can be edited and used in your application.” More on that here (Using VI Snippets to Store and Share Reusable Code Sections – National Instruments) 

Figure 1 – VI Snippet DateTime String

Note: This image is a LabVIEW snippet, which includes LabVIEW code that you can reuse in your project. To use a snippet, right-click the image, save it to your computer, and drag the file onto your LabVIEW diagram. 

Introducing Snippets in my workflow 

At the surface, the Snippet is a cool way to share and reuse frequently used code. Similar to my userlib folder where I store my vi libraries, I have a folder on my computer where I catalog my snippets in subfolders (e.g. general, frameworks, arrays, tdms, SQLite, DAQmx, etc.) so that they can be located with minimal effort. Actually, I have two locations on my computer that I store snippets: A private folder that I use as my personnel sandbox and a public folder that I share with my team. As with any collaboration or shared repository, you must be discipline or you will experience chaos. Our LabVIEW development team meets weekly for code reviews, discusses new projects, and to share best practices. At the end of every meeting, we invite team members to share any new vis and/or snippets they would like to add to the team’s repository.  

My first Snippet 

25 years ago, when I first started wiring G code, it was not such a big deal connecting all of those wires on the Block Diagram. However, as time passes and my eyes require a bigger monitor, I look for any hack that I can muster to limit the time spent wiring clusters and arrays. To that end I offer up the prewired Bundle By Name /Array. 

Figure 2 – Bundle/Unbundle/Build Array – Prewire

What’s next? 

How I use VI Snippets to make quick user dialogs.  

Introducing the LabVIEW Channel


I would like to introduce the ITM LabVIEW Channel, a series of blog posts related to building efficiencies in LabVIEW. In the weeks and months ahead my team and I will share past insights, lessons learned, and explore new programming concepts. This will be a sand box of sorts with a focus on solving problems using LabVIEW.

Please join us on our new LabVIEW Channel and subscribe below.

Preview What’s Next: VI Snippets

Related Links

Prevent Costly Mistakes on Industrial Monitoring Hardware Updates


Are you contemplating updates to your industrial monitoring hardware? Perhaps a COVID slowdown has given your team time to finally upgrade to that latest and greatest National Instruments controller.  

Before you make that leap, there’s one extremely important factor to consider, and that is the software running your equipment. If your code isn’t ready, there is far more to consider than a simple hardware swap, and your crew could be headed toward a serious loss in productivity and efficiency.  

The reality is that production engineers are routinely staring at industrial monitoring equipment that is nearing or reaching end-of-life, and they need to act to prevent unforeseen failures. The team at Integrated Test & Measurement can help with hardware upgrades, but we can also dive into your software to be sure your code is up to date and any customizations that have been made over the years are updated to assure your complex equipment is communicating the way it was designed to and all signals continue to report properly.  

Why is this holistic hardware/software approach recommended when it comes to upgrades? Consider the situation where a client upgrades a control module on a test cell only to find out that the new equipment is no longer compatible with the old software. It is akin to adding a new printer to your desktop computer without upgrading the drivers. Only in this instance, the fix is far more complex than a quick download. The result is that piece of equipment may now need to come offline for an extended time, and if you don’t have an in-house spare, your industrial monitoring is about to take a hit.  

ITM has seen an uptick in requests for assistance from clients who are running either outdated hardware, software or both. In some instances, partners may no longer have access to the person who customized their software. But that is no problem for ITM. Our LabVIEW experts are adept at not only understanding these complex software changes but they can clean up your code to simplify future upgrades, too. In other words, if your programming resources are no longer available, look to ITM for support with code enhancements, development and updates. 

One common migration for ITM’s industrial monitoring clients, for example, is moving from an older NI CompactRIO to a newer more suped up CompactRIO. A common mistake in this and other instances is underestimating the time it may take to update custom software, so rather than trying to do the work in house, let ITM speed up your process.  

Our experts can travel to your site, evaluate both your equipment and your software running it to develop and implement an upgrade plan that works for your team. Whether that means a slower measured approach or a quick turnaround on a tight deadline, ITM will develop a custom solution that meets your needs. 

Industrial Monitoring Tools: cRIO-9046 Embedded Controller

CompactRIO cRIO-9046

One of the tools our embedded software engineers commonly use for industrial control and process monitoring applications is the NI CompactRIO (cRIO) controller. These controllers let our engineers deploy autonomous systems that use complex algorithms to generate process outputs or key performance indicators (KPIs) from structural, vibration, and process monitoring sensors.

For example, in one of the latest industrial boiler monitoring applications, we embedded a cRIO-9046 controller with our Sootblower Fouling Detection (SFD) algorithms which are used to compute and then output equipment health and process efficiency KPIs. Let’s take a look at the cRIO-9046 controller’s specifications, functionality and programming.

cRIO-9046 is an 8-Slot CompactRIO Controller that has an Intel Atom 1.30 GHz Dual-Core CPU, 2 GB DRAM, 4 GB Storage, a Kintex-7 70T FPGA that can operate from -40 °C to 70 °C. The eight slots are used for C-Series conditioned IO modules that connect sensor inputs and data/control outputs and buses.

Its operating system, NI Linux Real-Time (64-bit), allows real-time performance with the usability desktop operating systems. Our engineers use Xilinx Kintex-7 7K70T FPGA to implement high-speed, (MHz) low-latency hardware-level data processing and decision-making. The cRIO-9046 also has several connectivity ports, including 2x Gigabit Ethernet, USB 3.1, USB 2.0, RS232, and RS485 ports.

Embedded LabVIEW developers can use these ports and standard communication protocol toolkits to develop standard or custom machine/system interfaces.

For a cRIO-9046 or other CompactRIOs to operate, custom LabVIEW RT applications must be developed and then deployed to each controller. Depending on the complexity of your application, you may also need to develop and deploy LabVIEW FPGA code to the cRIO’s FPGA. Over the years, our embedded software engineers have developed a standard architecture as well as software tools for communication and analysis routines to simplify the custom LabVIEW RT application development. They also have experience developing embedded LabVIEW FPGA code for advanced hardware-level signal processing.

For more information about the cRIO-9046 and our LabVIEW development capabilities, contact Mark Yeager via email at mark.yeager@itestsystem.com

Related Links

Silo Load Monitoring


Plant operators need to continuously measure bulk material levels/weight in their silos and hoppers to ensure their processes are running safely, efficiently, and without bottlenecks. Measuring these levels allows operators to automate vessel filling, verify material consumption, and prevent overfilling.

What we offer

ITM provides its customers with a variety of structural load monitoring systems. Using strain gauge based transducer technology, ITM can design and implement a real-time system to continually monitor load responses of the supporting members on an array of structures.

Strain gauge based measurements are more accurate and typically less expensive than load cell retrofitting. The addition of a monitoring system can also reduce the risks associated with manual measurements including contamination of product and, more importantly, injury to a worker.  

How do you measure bulk material levels/weights in silos and hoppers?

The two ways to measure bulk material quantity in silos/hoppers are level indicators (laser, ultrasonic, radar) and weight measurements (load cells, strain gauges).  Weight measurements are more accurate, safer to install, and can be installed during operation.  Of the types of weight measurements, ITM prefers to implement strain gauge-based solutions since they do not require structural modification of the vessel.

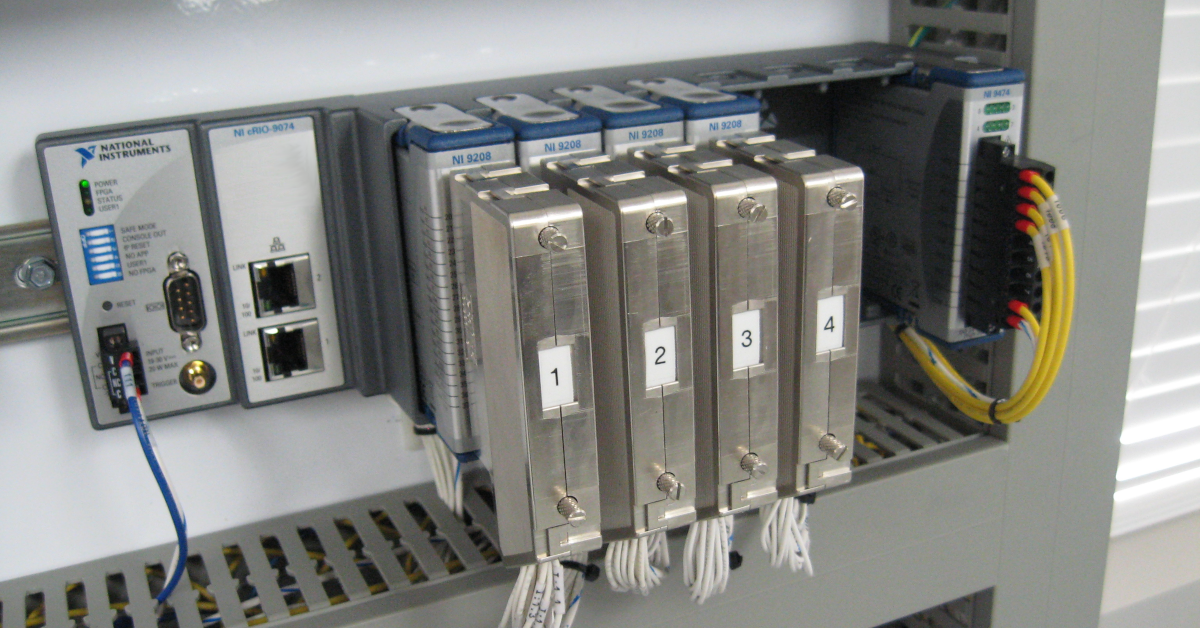
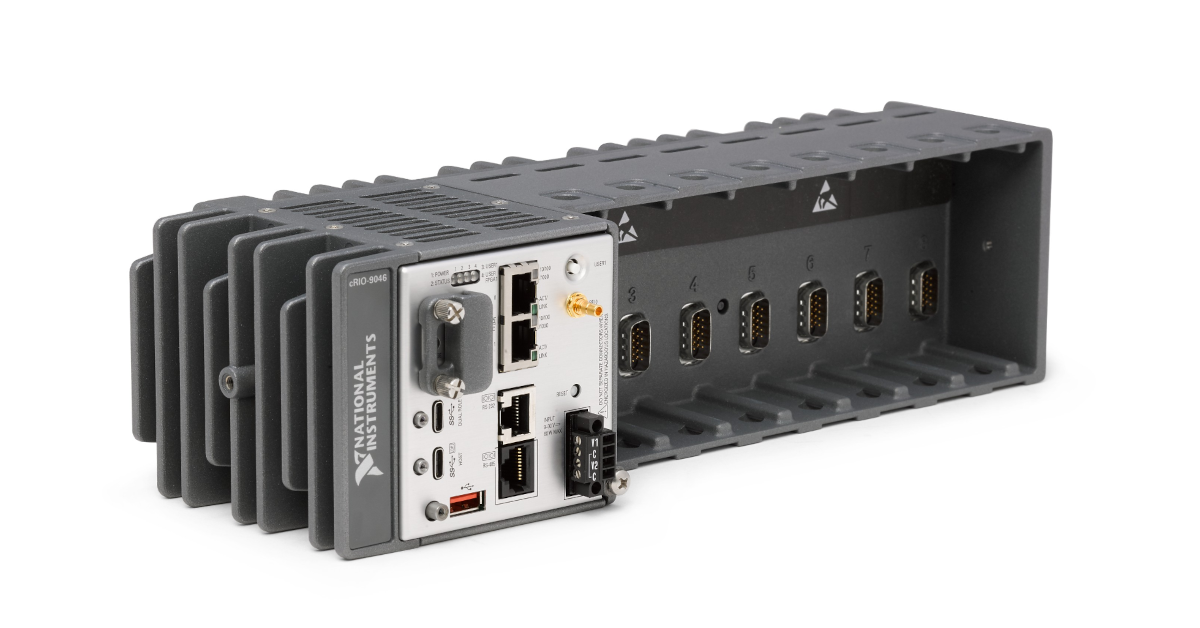
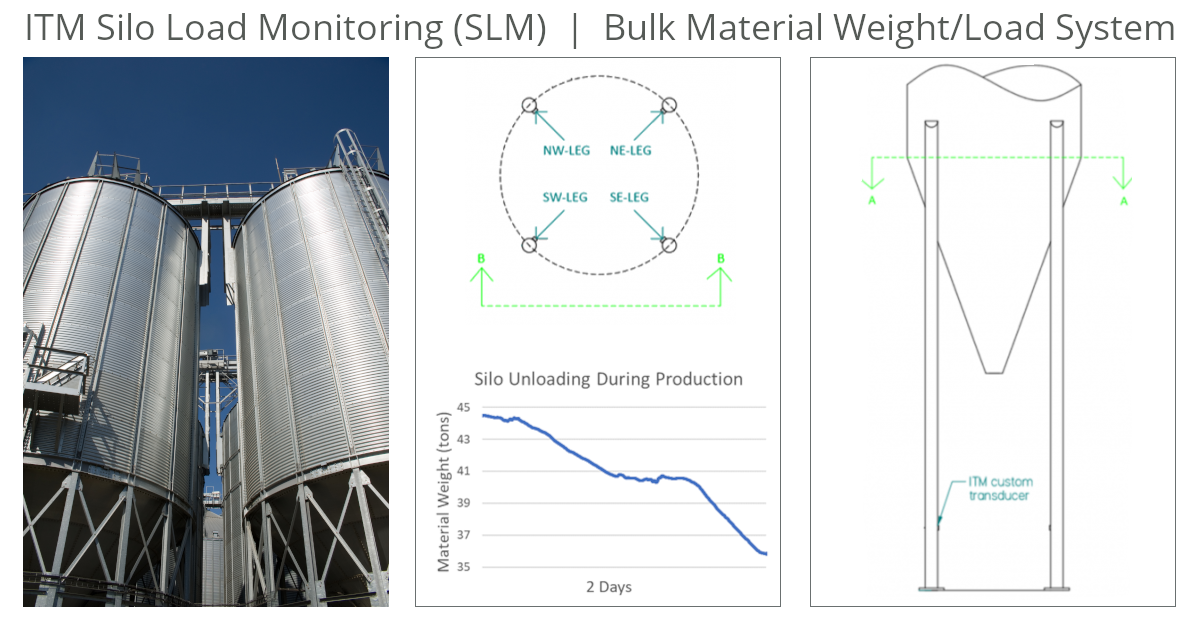
An ITM silo monitoring system typically consists of weatherproofed strain gauges for each silo leg and a NI CompactRIO embedded controller to acquire data, process signals, and output results. Systems are scalable to accommodate all the silos at the plant.

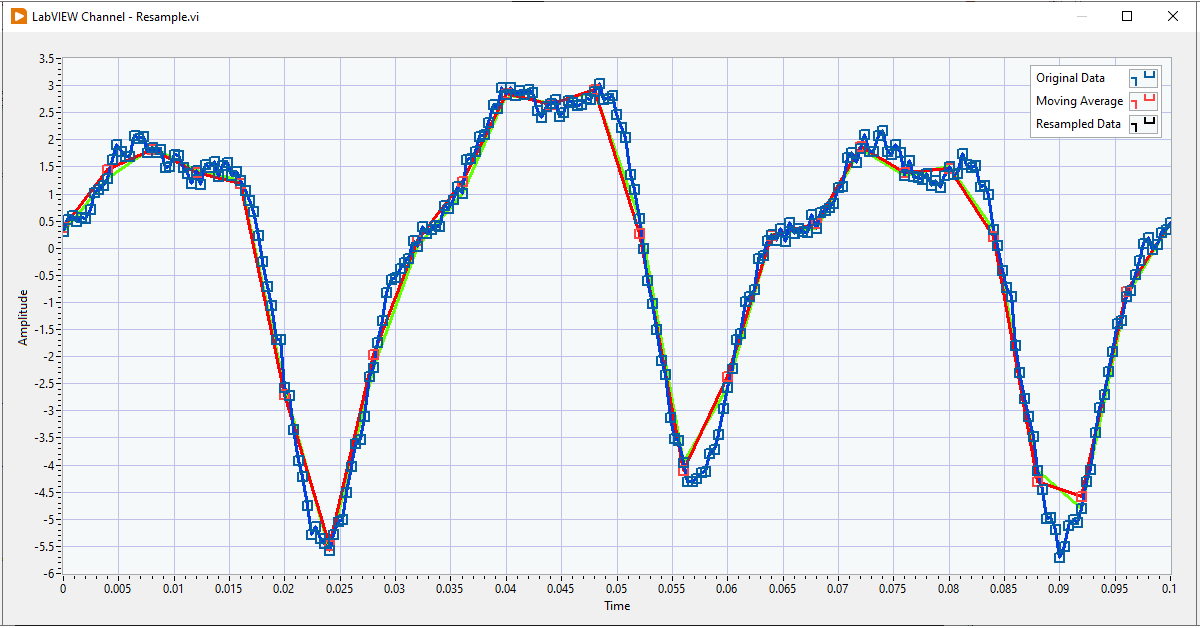
The graph above shows a typical trend of real silo data during unloading.  Weight levels are sent directly to factory DCS systems and historians via common communication protocols like Ethernet/ip and Modbus, or they can be viewed on the system’s webpage or a local/remote workstations and panels.

What are the challenges when measuring bulk material levels/weights?

Most bulk material storage is outside, so temperature and other environmental factors must be accounted for not only in the durability of the equipment, but in the sensor design and data processing. Changes in temperature, wind, and humidity can result in changes to the load path in silo legs. Load changes are account for by instrumenting all or most of the silo legs and selecting the appropriate strain gauge bridge design which results in continuously accurate weight measurements.

While other systems require calibrating the system with known loads (point calibration), ITM calibrates the system using a shunt voltage across the strain gauge bridge. This process automatically calibrates the system and eliminates the requirement of having pre-known material weight added to the vessel.

For more information about silo monitoring, contact Ryan Matthews @ 1.844.837.8797 x706.  To see how ITM’s structural load monitoring systems work watch this video below.