Structural Validation & Testing of Generator Sets
A case study describing a reliable system for testing generator vibration levels after production in order to verify proper unit design and assembly.

A case study describing a reliable system for testing generator vibration levels after production in order to verify proper unit design and assembly.
Finding efficiency improvements and uncovering hidden unsafe conditions in a process can prevent injury and save your company millions.

Sang-Soo Kim is used to overcoming bumps in the road. After all, his career is centered on developing technology that improves pavement conditions.
The Ohio University researcher and civil engineering associate professor was facing a fast-approaching deadline to prove his novel asphalt testing device was worthy of startup funding from the state of Ohio when he turned to Integrated Test & Measurement (ITM) for help.
The preeminent researcher had a challenge for Chase Petzinger, ITM software engineer. His scratch-built device — essentially an extreme oven/freezer combo that heats or freezes pucks of asphalt material to force expansion or contraction — needed complex hardware and a custom software solution to control signals from the device and ultimately record asphalt cracking data.
“I was extremely happy and impressed with ITM’s technical skills,” said Kim. “I was on a very tight schedule to finish the project in time, and they were very flexible and accommodating to my needs.”
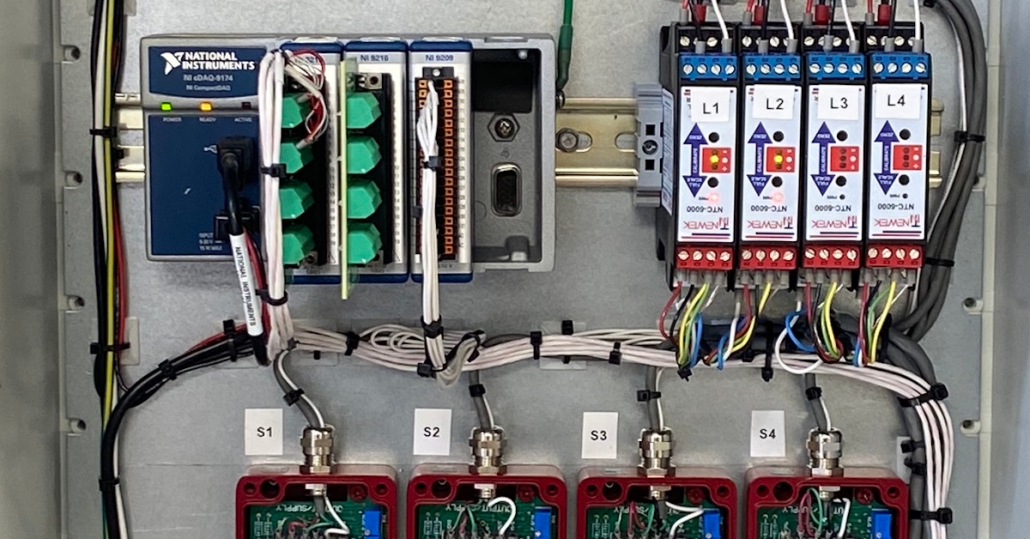
The job required ITM’s team to develop software to record data from National Instruments hardware as well as control and monitor a custom built Watlow Programmable Logic Controller. In addition, the team had to design and build an enclosure that held all the data acquisition equipment and did all the power-cable management signal conditioning.
“So he had the oven shipped to us, and then he showed up with a big box of all the stuff that he had brought,” recalls Petzinger. “He set it down and said, ‘Okay, make this work.’”
Specific sensors and fixtures included GT1000RA LVDT Sensors, NTC-6000 signal conditioners, RDP S7AC signal conditioners and custom-built stainless-steel fixtures. In addition, the data acquisition process required employing a NI cDAQ-9174 Chassis, NI-9216 RTD modules as well as an NI-9209 Voltage Module.
Petzinger explained that he was able to customize the software application using LabVIEW to both collect the data from the sensors inside the oven as well as directly communicate with the device to control start and stop functions as well as the temperature inside.
“I think there were about 50,000 rows in this Excel document of different commands and ways that I could talk to the device,” said Petzinger. “I had to figure out how to use that information and then start from scratch writing a program that would send the commands that the oven could actually interpret.”
Petzinger considers these types of automation and data logging applications a melding of both science and art.
“We were able to create an application to communicate with a unique piece of hardware that we had never seen before,” he said. “if you have your own proprietary oven or switch or machine or something, we’ve worked with unique applications before, and we can do it again.”
Thanks to ITM, Kim not only was able to present his device to the Ohio Department of Development, but it outperformed even his own expectations.
“We wanted to demonstrate this testing device is indeed able to predict low-temperature performance,” he said. “We ran the test with the device that ITM made, and we had one of the best correlations I’ve seen in an asphalt pavement study.” Kim says ITM helped him prove that his device can predict which mixtures of asphalt will crack more accurately than existing tests. And, importantly, it will yield results in a single day where traditional asphalt studies take a week or longer. Next up in his effort to commercialize the unit, Kim intends to publish the results of his work in industry publications, and he’s already seeking a patent.
For more information about this project or other LabVIEW development projects contact Mark Yeager @ (844) 837-8797 x701
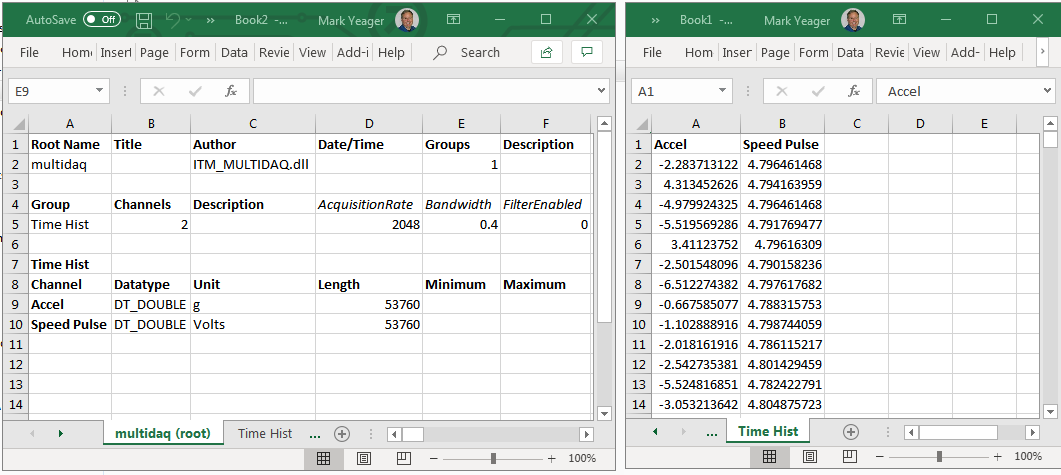
TDMS Data file after import into Excel
Precision testing generates precision data. Acquiring, accessing, and analyzing these data files allows engineers and scientists to lower product costs, engineer time-saving solutions, and even save lives. National Instruments (NI) created the Technical Data Management Streaming (TDMS) file format for high performance data streaming and retrieval. This binary file is structured for easier sorting and access of the complex data within the file.
Are you looking for expert assistance understanding and manipulating TDMS data files? ITM has greatly simplified things with iTestSystem, its free custom engineering software platform that enables you to organize, acquire, view and analyze data.
Allow our experts to walk you through TDMS files or point you to our free solutions.
Before NI standardized on the TDMS data file engineers and scientists had to create their own high-performance file types. The TDMS file format is supported not only by iTestSystem, but also across all NI software.
WHAT HAPPENS WHEN YOU WANT TO SHARE THESE FILES WITH COLLEAGUES WHEN THEY DO NOT HAVE ITESTSYSTEM INSTALLED ON THEIR COMPUTERS?
In these instances, it is often easiest to export a TDMS file to a more commonly used file type like Microsoft Excel (XLSX).
NI provides a free program / plug-in that allows users to open TDMS files in Microsoft Excel. This means anyone can convert a TDMS file into an XLSX file and open it in Excel, and once there the file can be easily saved just like any other spreadsheet. Once saved as an Excel file, you can share, open, view and edit it just like any other XLSX file.
HOW DO I GET THE TDMS IMPORTER PROGRAM / PLUG-IN FOR MICROSOFT EXCEL?
If you have installed iTestSystem Engineering Measurement Software, the TDMS Importer program / plug-in for Microsoft Excel is already installed. If not, then you can download the software here: https://www.ni.com/example/27944/en/
Once you have downloaded the NITDMExcel program by following the link and using the built-in installation wizard, you can save TDMS files as XLSX Excel files. To open a TDMS file in Excel, you can simply double-click the TDMS file. If that doesn’t work, you will need to right-click, navigate to “Open With”, and find the NITDMExcel program wherever you installed it on your computer.
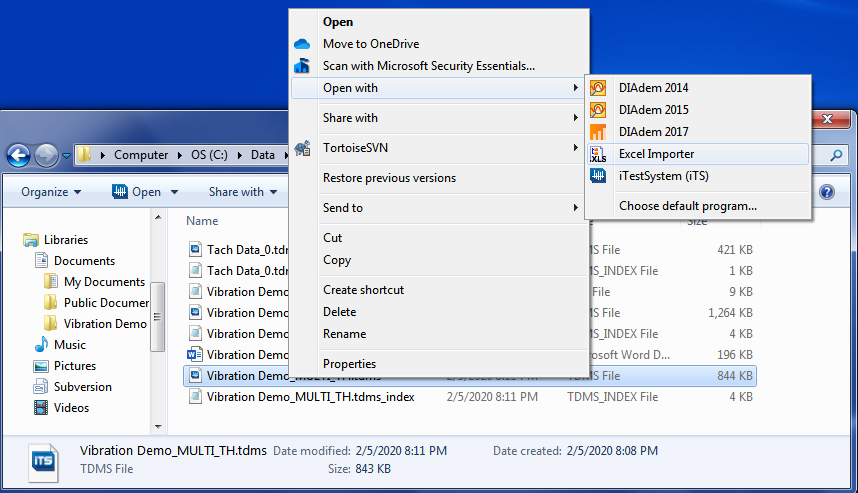
Right click on TDMS file to import file into Excel
Each time you open a TDMS file in Excel, it will create a new workbook. Each workbook will have multiple sheets, one for the file properties such as the name of the test, date the data was taken, and more. The other sheet(s) will contain the data points plotted as part of the test, which would normally be used to create graphs in TestView Plus.
Now you can save the Excel and share it just like any other XLS file!
Auto-Zero Utility Update
Wireless Strain Measurements with iTestSystem
Strain Gauge Installation for Field Testing
For more information about sharing data, iTestSystem Engineering Measurement Software, or test equipment rental, contact Ryan Welker @ (844) 837-8797 x702.
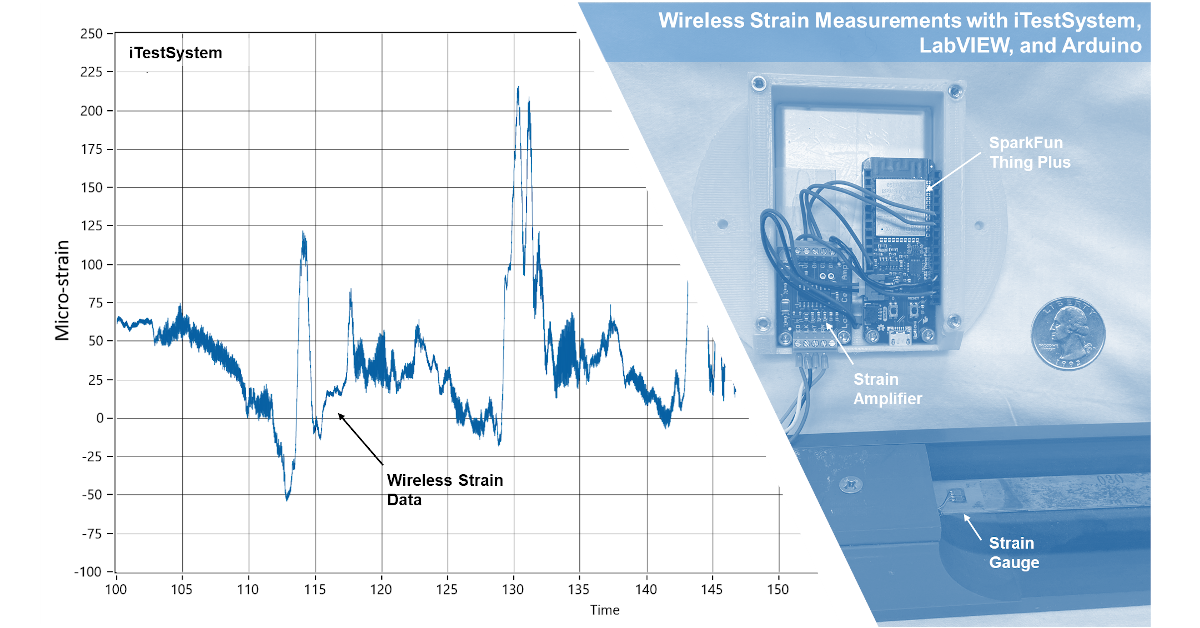
On a recent project, one of our engineers needed to measure structural strain at several locations on mobile lifting equipment while in operation. Since the strain measurements were distributed and mobile, a wireless internet of things (IOT) solution was required. This blog describes the steps and tools we used to integrate our solution into iTestSystem and LabVIEW™.
Are you looking for expert assistance with strain gauging, a wireless IOT solution or free custom engineering software platform that enables you to organize, acquire, view, and analyze data?
One of the wireless devices that we evaluated to monitor strain was a SparkFun Thing Plus (ESP32 WROOM) with a Load Cell Amplifier (HX711). The SparkFun Thing Plus uses the Espressif ESP32 Wi-Fi and Bluetooth MCU. It accepts a variety of digital interfaces including high-speed SPI, UART, I2S, and I2C. The HX711 load cell amplifier accepts four-wire Wheatstone bridges and outputs 24-bit data at either 10 Hz or 80 Hz. The digital signal from the HX711 was connected to a GPIO pin and clock pin on the SparkFun Thing Plus. We used a Lithium Ion 2Ah battery to power both devices.
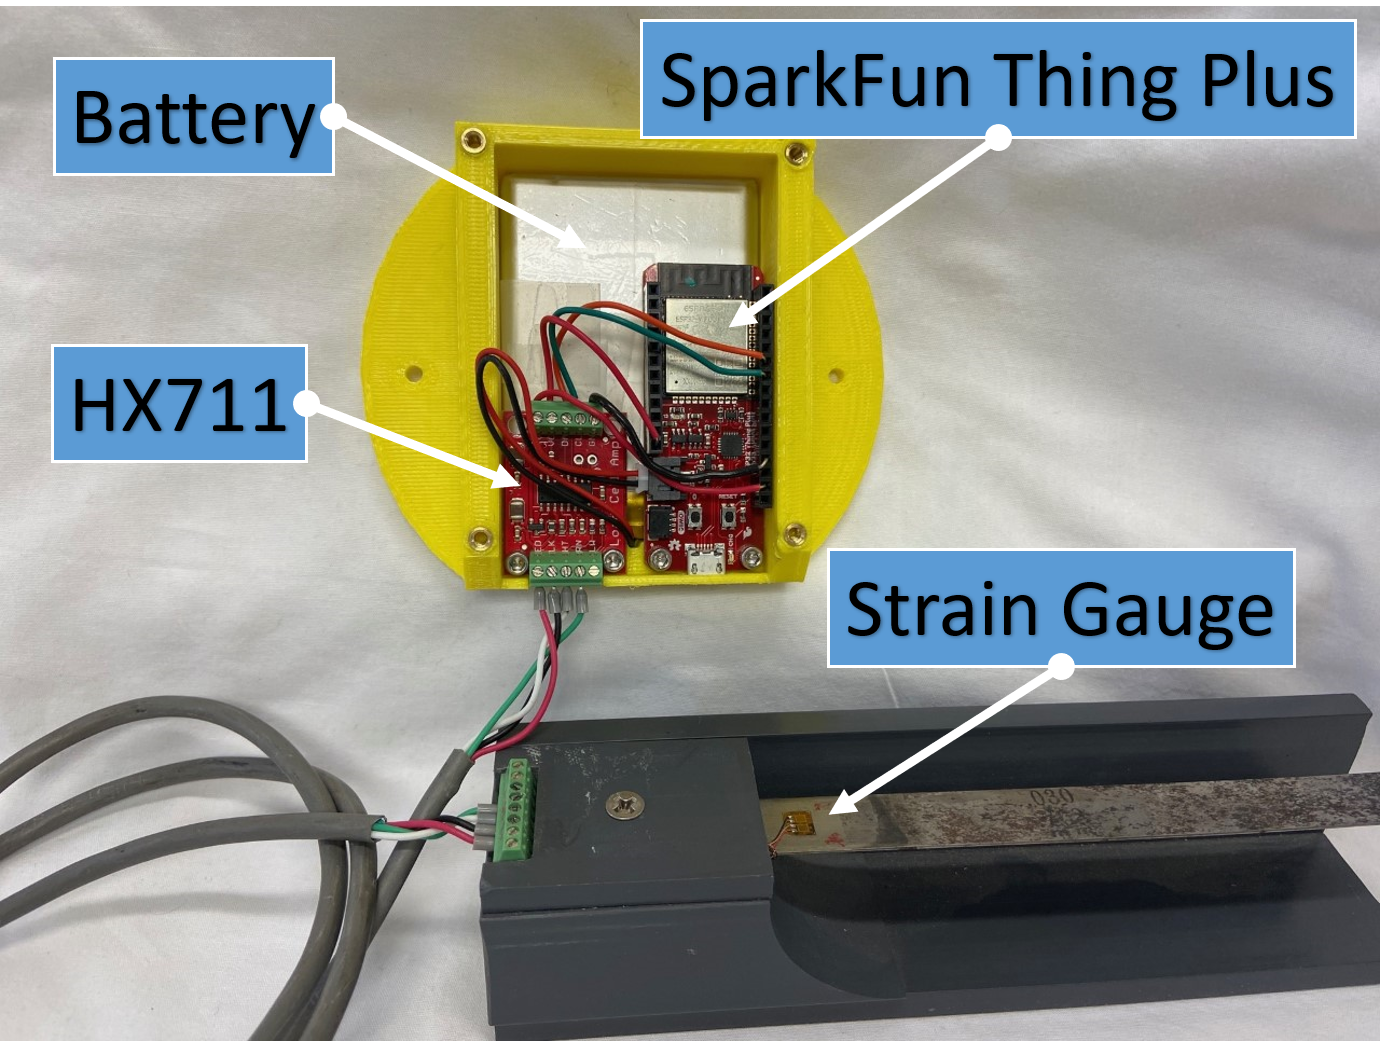
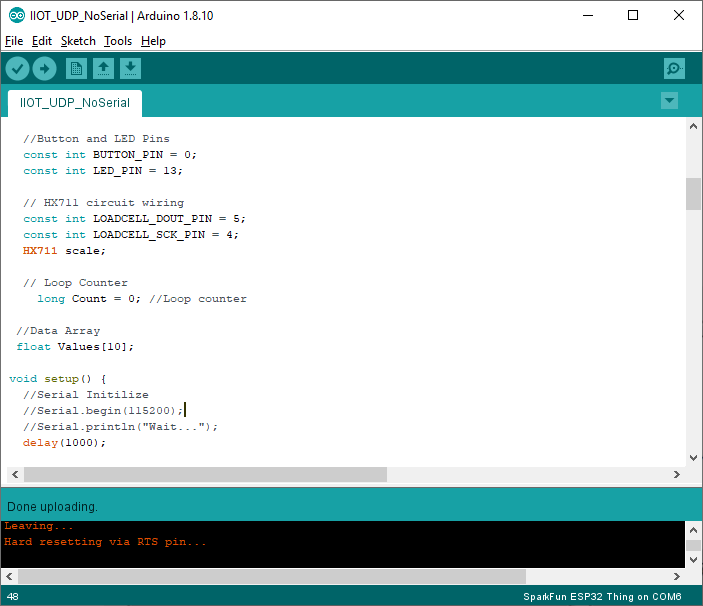
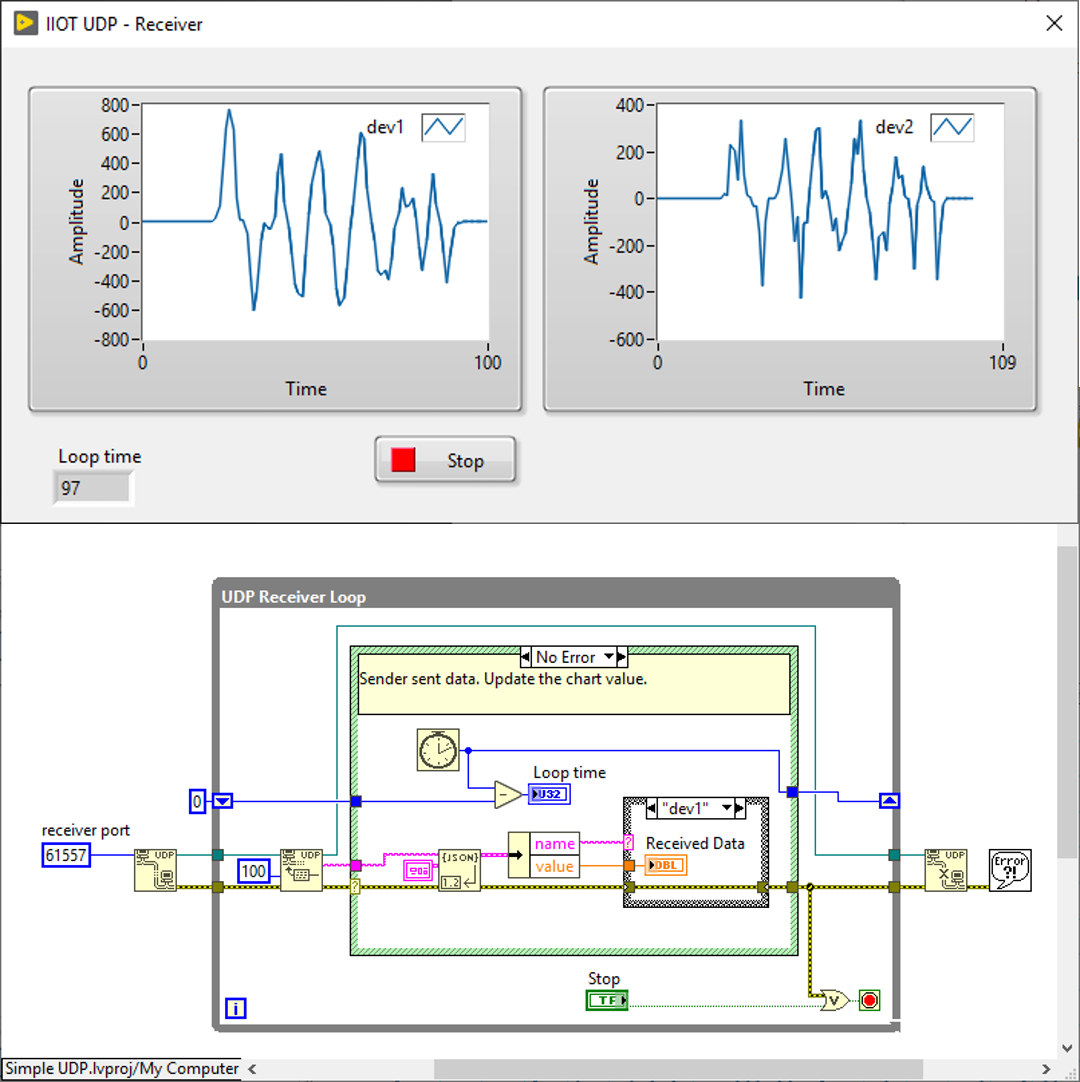
After making the connections and installing the device in a 3D printed case for mobility testing, our development engineer programmed this device using the Arduino IDE. Our wireless strain prototype was programmed to auto connect to a Wi-Fi network and output device ID, tag names, and data values via UDP or Webservice. We chose UDP because we only needed the latest strain/load values. Bundling the device ID with the strain data would allow iTestSystem to collect data from multiple devices. To test the wireless strain prototype and develop the UDP interface for iTestSystem, we modified the Simple UDP LabVIEW example vi.
Next, we integrated the wireless strain prototype into iTestSystem by adding a new communication class into the existing iTestSystem IOT Communication utility. This new class allowed the utility to read the specific UDP data type associated with our prototype and output data to a shared variable. Shared variables can be logged to disk and analyzed with iTestSystem alongside other machine data.
For more information about this application, iTestSystem, or our strain gauging services, contact Mark Yeager via email at mark.yeager@iTestSystem.com or phone @ 1.844.837.8797 x701.
Over the years we have been tasked with identifying the root cause of machine structural failures. In many cases, we can determine the failure mode through strain and vibration testing, order analysis, modal analysis, and operating deflection shape analysis. What tests can you run when the damaging conditions are intermittent and not easily identified?
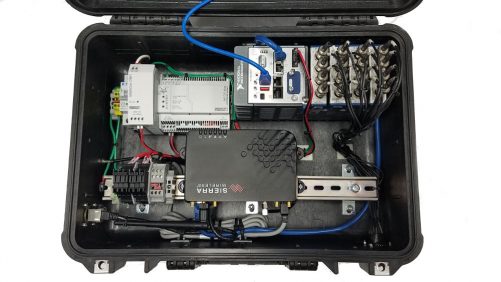
In these cases, we like to install a cellular networked temporary data acquisition (DAQ) system that can autonomously log vibration and strain data along with machine status data. We have deployed two types of DAQ systems to collect data remotely. An interactive system that includes an industrial PC running our iTestSystem software and National Instruments (NI) Compact DAQ hardware and a headless system that utilizes NI Compact RIO hardware. Our test engineers prefer using the interactive solution for troubleshooting because they can view real-time signal waveforms and collected data files, and then adjust the test parameters accordingly without having to reprogram the hardware.
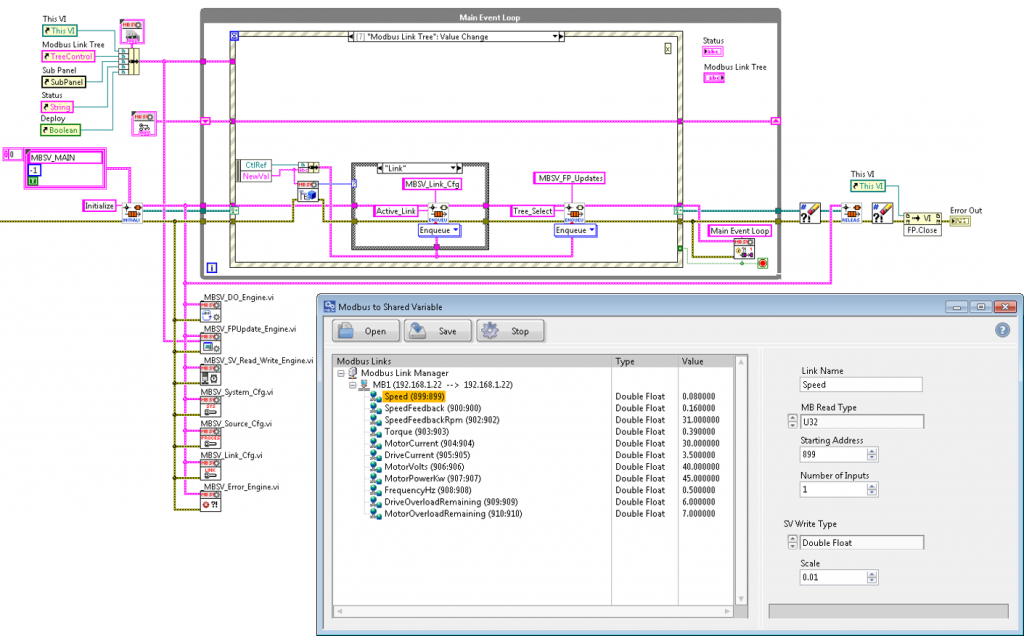
When potentially damaging events are identified in the vibration and strain data collected by these systems, it is important to know the machine’s operating status. Collecting the machine status information is just as important as collecting the structural data. Many machines transmit these operating variables and operating stages over their network/bus. Recently we have recorded process data from Allen Bradley Control Logix PLCs via Ethernet/IP, mining machine data from a Siemens controller via proprietary TCP/IP protocol, boiler condition data from a DCS via Modbus TCP, machine pressures from PI historian via the UFL connector (TCP), and vehicle speeds and pressure via CAN. Fortunately, we were able to use and adapt LabVIEW communication protocol tools to build applications and addons that allow this network tag data to be collected along with structural data.
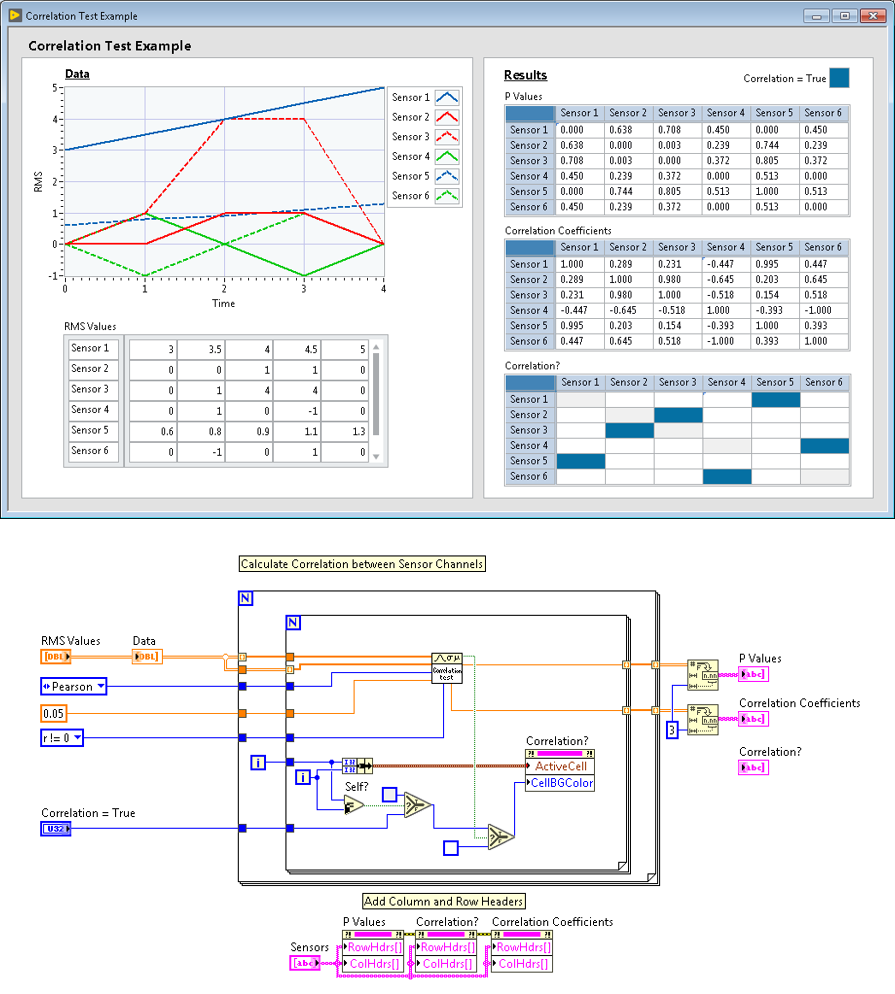
After the data collection phase, our engineers perform statistical analysis on the sensor and status channels in all data files and aggregate the results into a database for searchability. To identify the root cause probabilities, you can process the channel statistics data using your favorite correlation algorithm or application. The image below shows an example data set containing related sensor data that was processed using a LabVIEW correlation test tool.
Contact Information: For more information about our remote data acquisition service, our LabVIEW development service, or iTestSystem contact:
Mark Yeager – Integrated Test & Measurement (ITM), LLC. Email: mark.yeager@itestsystem.com or Phone: 1.844.TestSys
Recent News: Ohio University Asphalt Cracking Prediction System Project
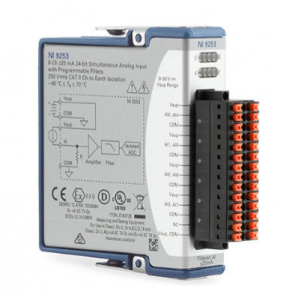 This week we added another module to the iTestSystem compatibility list. One of our iTestSystem users recently needed to collect data from thirty-two (32), 4 to 20 mA current sensors along with their vibration measurements. National Instruments (NI) recently introduced a new C-Series current module, the NI-9253, that was a perfect fit for this application.
The NI-9253 module has eight (8) simultaneous sampled (50kHz max), +-20 mA, 24-bit input channels. It has several diagnostic features to ensure your system is operating nominally at all times with open channel detection, power supply detection, and configurable thresholds. The NI-9253 has eight LEDs that indicate the status of each channel and the power supply so a user can easily determine the system’s status in the field. The NI-9253 also features a number of programmable hardware filters (Butterworth and comb) to reduce signal noise.
in iTestSystem monitoring applications or with custom cRIO RT and FPGA control applications contact Mark Yeager or Chase Petzinger.
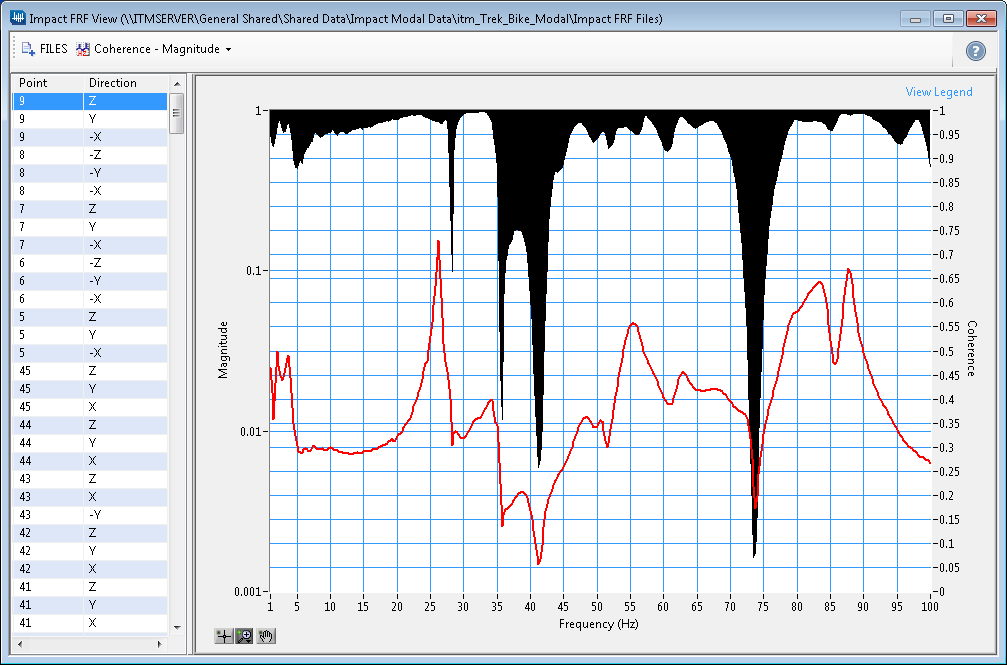
In order to prevent or troubleshoot structural vibration problems, it is important to characterize a structure’s dynamic behavior using both experimental and Finite Element Analysis (FEA) technologies. One method used to identify a structure’s vibration modes is to perform a roving accelerometer or roving hammer impact test. In an impact test, engineers measure the response of a structure from an impulse delivered by a calibrated hammer using tri-axial accelerometers.
Managing impact tests on large structures can be tedious and cost prohibitive, since they require collecting accelerometer responses at hundreds of locations to resolve the vibration motion. Not only do test engineers need to keep track of the locations, they also need to keep track of the orientation that an accelerometer is positioned.
Our test engineers have found that the most efficient and cost effective solution for collecting impact data is to use a National Instruments (NI) cDAQ chassis with either NI-9234, NI-9232, NI-9231 or NI-9230 IEPE modules along with a calibrated impulse hammer and between 3 – 9 tri-axial accelerometers. To collect, manage, and visualize the modal data, our LabVIEW software engineers developed the Impact Test DAQ, FRF Viewer, and 3D Animator applications for our iTestSystem software platform. These applications incorporate tools that our test engineers need to manage and validate the quality of their modal data while in the field.
For more information about impact tests, modal analysis, our iTestSystem Impact Test applications, or to schedule a modal test contact Mark Yeager or Ryan Welker.
 The FieldDAQ™ FD-11634 sound and vibration input module from National Instruments (NI) can now be used with the latest version of iTestSystem for your data collection needs. The FD-11634 is similar to the NI-9234, NI-9232, NI-9231, and NI-9230 cDAQ dynamic input modules and can be used with IEPE type sensors such as accelerometers and microphones. Like the other FieldDAQ™ modules, this module is IP65/IP67 dust and water resistant with an operating temperature range of -40 °C to 85 °C. Our test engineers would use these modules for collecting vibration data on mining and construction equipment, vibration data on rotating machinery within manufacturing facilities and test cells, and acoustic data for measuring equipment noise emissions. No matter your need, data logging with this equipment is sure to impress.
The FieldDAQ™ FD-11634 module has 8 simultaneous sampled, ±1V or ±10 V, 24-bit differential input channels with AC/DC coupling. It has a maximum sample rate of 102.4kS/s and features built in anti-aliasing filters that automatically adjust to the sampling rate.
For advice about using the FieldDAQ™ FD-11634 sound and vibration modules in iTestSystem monitoring applications or with custom cRIO RT and FPGA control applications contact Mark Yeager or Chase Petzinger.
Click Here to view a video showing one of our test engineer collecting data from a submerged FieldDAQ™ module with iTestSystem.
Click Here for more information about iTestSystem.

Come see us at the VIATC 2019 Exhibit Hall in Booth 33!
Ryan Welker and Mark Yeager (CAT III Vibration Analysts) will be there to answer questions about our iTestSystem engineering measurement platform, our on-site testing services, LabVIEW consulting, and strain gauging services.
When: July 24 & 25th
Where: The VIATC 2019 conference and exhibit hall will take place at the Lexington Center, connected by a joint lobby to the Hyatt Regency Lexington.

ITM provides software development, structural and mechanical testing services, industrial monitoring, strain gauging, and data analysis solutions to clients on six continents. ITM is a recognized National Instruments Gold Alliance Partner.
![]()